Example - Catalog Module
[1]:
%matplotlib inline
import numpy as np
import matplotlib.pyplot as plt
import healpy as hp

# suppress matplotlib warnings
import warnings
warnings.filterwarnings('ignore')

from estats.catalog import catalog

# A function for visualization of the maps
def vis_maps(m, title):
    hp.mollview(m, title=title)
    plt.show()
    plt.clf()
Produce a mock weak lensing catalog with coordinates, galaxy ellipticities some additional field for magnitude for example and tomographic bins for each object (totally unphysical)
[2]:
np.random.seed(0)

length = 10000000

# coordinates
alpha = np.random.rand(length) * 50.0
delta = -30. + np.random.rand(length) * 50.
# ellipticities
e1s = -0.5 * np.random.normal(size=length)
e2s = -0.5 * np.random.normal(size=length)
# redshift
redshift = np.random.randint(1, 4, size=length)
# some scalar field, for example magnitude
magnitude = np.random.normal(size=length)
Create the estats.catalog object (note that if you want to add an additional field the name must contain field for it to be recognized as a field). Can also pass a list with galaxy weights. Here we let the code set them all to 1
[3]:
cat = catalog(alphas=alpha, deltas=delta, e1s=e1s, e2s=e2s, redshift_bins=redshift, magnitude_field=magnitude, NSIDE=1024)
2022-04-06 14:40:40,552 - catalog.py: 332 - WARNING - Passed empty list for weights. Setting all to 1
We remove galaxies with extreme ellipticities above 1.0
[4]:
cat.clip_ellipticities(1.0)
2022-04-06 14:40:40,956 - catalog.py: 355 - INFO - Clipped ellipticity to 1.0 -> Removed 13.52522% of objects.
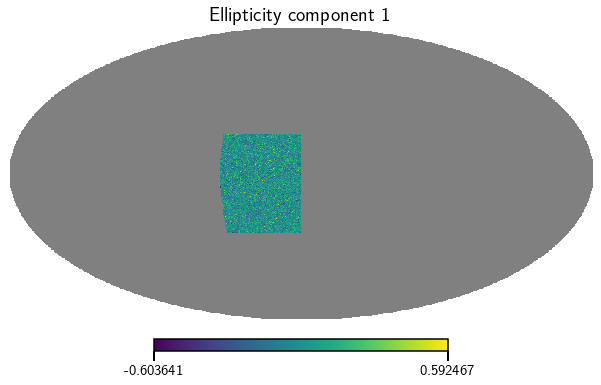
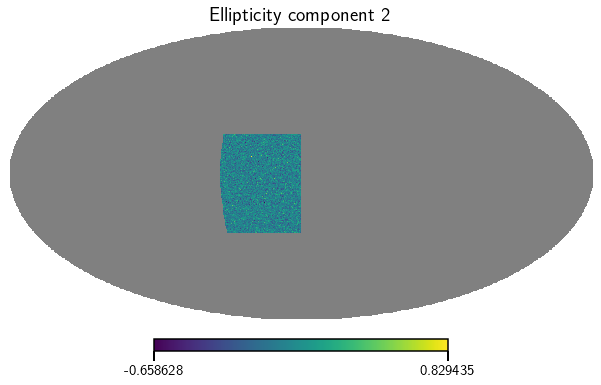
Now lets produce a few maps from this. Here we calculate the ellipticity maps for the whole sample.
[5]:
e_1, e_2 = cat.get_map(type=['ellipticities'], bin=0)
vis_maps(e_1, title='Ellipticity component 1')
vis_maps(e_2, title='Ellipticity component 2')
<Figure size 432x288 with 0 Axes>
<Figure size 432x288 with 0 Axes>
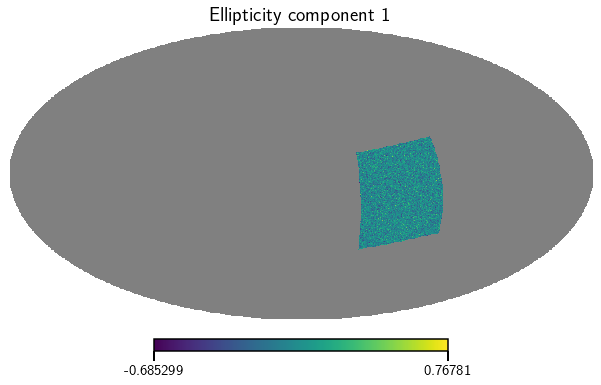
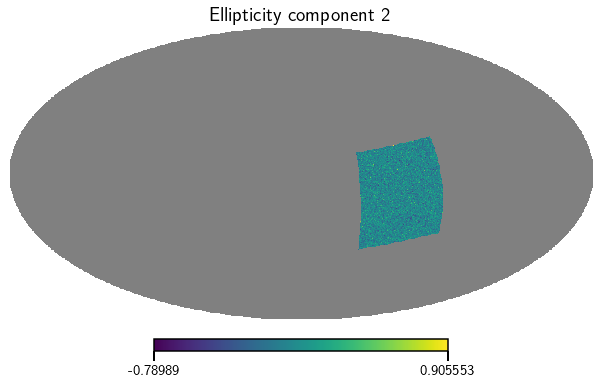
Rotate the survey on the sky and plot the maps again
[6]:
cat.rotate_catalog(alpha_rot=1.5, delta_rot=0.2)

e_1, e_2 = cat.get_map(type=['ellipticities'], bin=0)
vis_maps(e_1, title='Ellipticity component 1')
vis_maps(e_2, title='Ellipticity component 2')
<Figure size 432x288 with 0 Axes>
<Figure size 432x288 with 0 Axes>
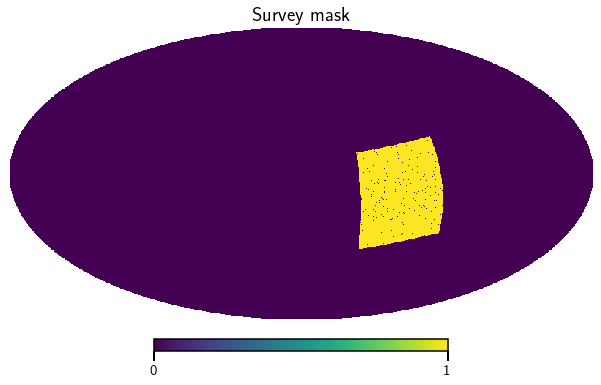
Now lets have a look at the survey mask but only for the galaxies in the second tomographic bin
[7]:
mask = cat.get_mask(bin=2)
vis_maps(mask, title='Survey mask')
<Figure size 432x288 with 0 Axes>
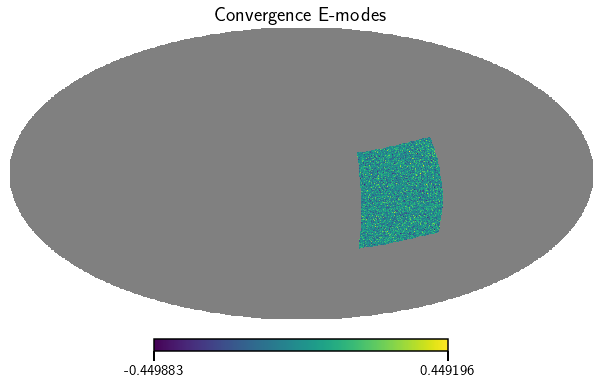
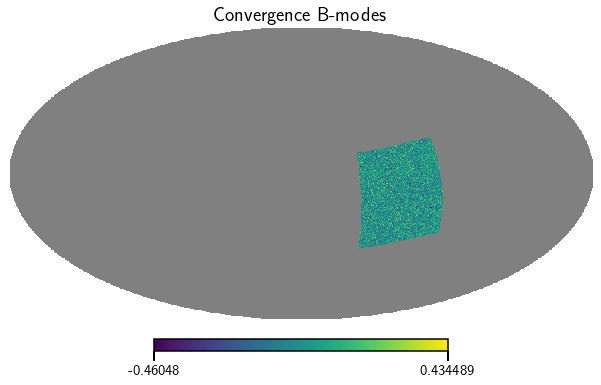
We can also convert the ellipticity maps to convergence maps using the spherical Kaiser-Squires map making procedure.
[8]:
# get the weights, shears and convergence (E and B mode) map products for the whole survey
kappa_E, kappa_B = cat.get_map(type=['convergence'], bin=0)
vis_maps(kappa_E, title='Convergence E-modes')
vis_maps(kappa_B, title='Convergence B-modes')
<Figure size 432x288 with 0 Axes>
<Figure size 432x288 with 0 Axes>
Lastly we can also get a map of the additional scalar field magnitude_field
[9]:
mag_map = cat.get_map(type=['magnitude_field'], bin=0)[0]
vis_maps(mag_map, title="magnitude")
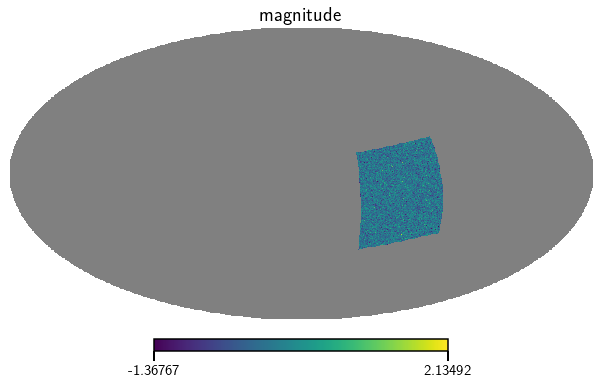
<Figure size 432x288 with 0 Axes>
We can create a shape noise map by randomly rotating the ellipticities of each galaxy in place. Lets generate such a map using the galaxies in the first tomographic bin only.
[10]:
noise_map_1, noise_map_2 = cat.generate_shape_noise_map(seed=100, bin=1)
vis_maps(noise_map_1, title='Shape noise component 1')
vis_maps(noise_map_2, title='Shape noise component 2')
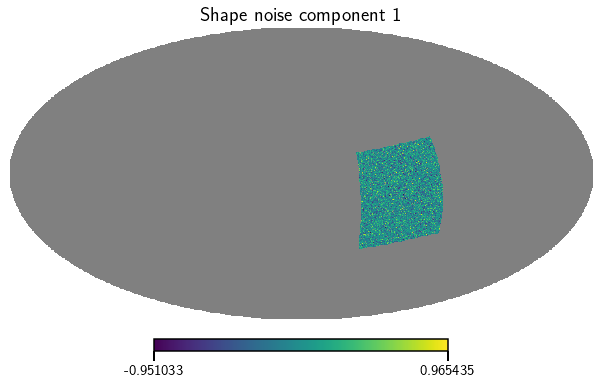
<Figure size 432x288 with 0 Axes>
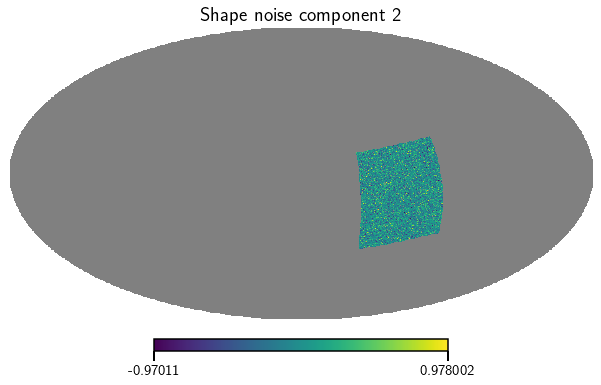
<Figure size 432x288 with 0 Axes>
We can also get the corresponding shape noise catalog
[11]:
noise_1, noise_2 = cat.generate_shape_noise(seed=100, bin=1)
print(noise_1)
print(noise_2)
[-0.11300217  0.34782493  0.37761191 ... -0.3215559  -0.03890152
 -0.20607017]
[ 0.3756832   0.07765827  0.68108641 ... -0.74850898 -0.33538276
  0.21781391]
Example - Map Module
The map module can hold multiple Healpix maps and allows the calculation of shear and convergence statistics from them using statistics plugins.
[12]:
from estats.map import map
We use the shear and weight maps as well as the survey masks from the catalog module to initialize an estats.map instance. The map instance can hold an arbitrary number of shear, weight and convergence maps. Here we initialize it with 3 instances, one for each redshift bin.
[13]:
weightss = []
shear_1s = []
shear_2s = []
masks = []
trimmed_masks = []
for bin in [1, 2, 3]:
    weights, shear_1, shear_2 = cat.get_map(type=['weights', 'ellipticities'], bin=bin)
    mask = cat.get_mask(bin=bin)
    trimmed_mask = cat.get_trimmed_mask(bin=bin)
    weightss.append(weights)
    shear_1s.append(shear_1)
    shear_2s.append(shear_2)
    masks.append(mask)
    trimmed_masks.append(trimmed_mask)

# initialize
m = map(gamma_1=shear_1s, gamma_2=shear_2s, mask=masks, trimmed_mask=trimmed_masks, weights=weightss, NSIDE=1024, Minkowski_steps=100)
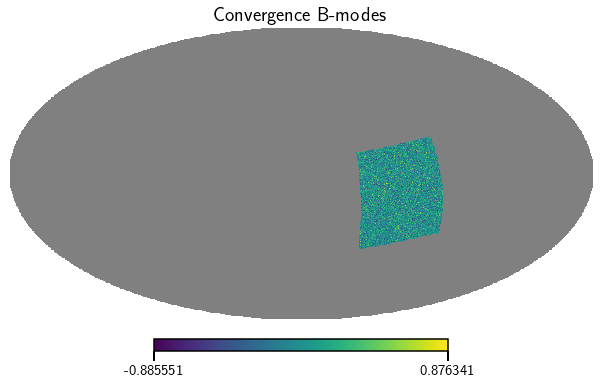
Lets have a look at the convergence maps of the second tomographic bin (estats.map uses spherical Kaiser-Squires to calculate them from the shear maps). The bin parameter determines which instance to return (indexing starts at 0).
[14]:
kappa_E, kappa_B = m.get_convergence_maps(bin=1)
vis_maps(kappa_E, title='Convergence E-modes')
vis_maps(kappa_B, title='Convergence B-modes')
2022-04-06 14:42:49,418 - map.py: 340 - WARNING - Convergence maps not set. Calculating from internal shear maps.
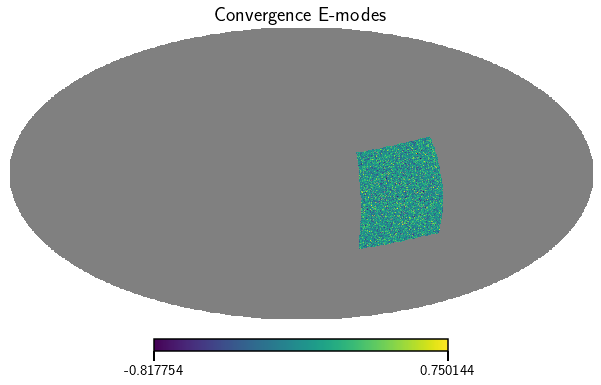
<Figure size 432x288 with 0 Axes>
<Figure size 432x288 with 0 Axes>
Statistics Calculation
The calculation of map statistics works via statistics plugins. The plugins are located in estats.stats and consist out of a few functions that determine how the statistic works. Please have a look at the “Implementing your own summary statistic” section to learn how to make your own statistic plugin. In the following we show the usage of a few of these statistics.
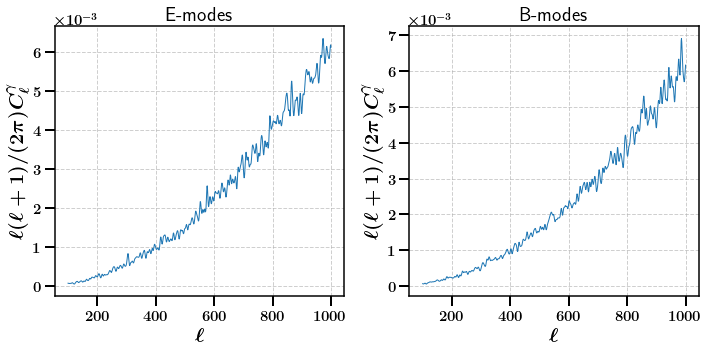
Shear Angular Power spectrum
We start by calculating the shear angular power spectrum for the first bin (as indicated by using bin=0).
[15]:
# This just uses the first maps since it is a statistic that acts on a single map (bin=0)
stats = m.calc_summary_stats(['ShearCLs'], bin=0)

fig, axarr = plt.subplots(ncols=2, nrows=1,figsize=(10,5))
axarr[0].plot(np.arange(100, 1000, 1), np.arange(100, 1000, 1)* (np.arange(100, 1000, 1) + 1) / (2. * np.pi) * stats['E']['ShearCLs'].ravel()[100:])
axarr[1].plot(np.arange(100, 1000, 1), np.arange(100, 1000, 1)* (np.arange(100, 1000, 1) + 1) / (2. * np.pi) * stats['B']['ShearCLs'].ravel()[100:])
axarr[0].set_title(r'E-modes')
axarr[1].set_title(r'B-modes')
axarr[0].set_xlabel(r'$\ell$')
axarr[0].set_ylabel(r'$\ell (\ell + 1) / (2 \pi) C_{\ell}^{\gamma}$')
axarr[1].set_xlabel(r'$\ell$')
axarr[1].set_ylabel(r'$\ell (\ell + 1) / (2 \pi) C_{\ell}^{\gamma}$')
plt.subplots_adjust(wspace=0.5)
Convegence Angular Power spectrum
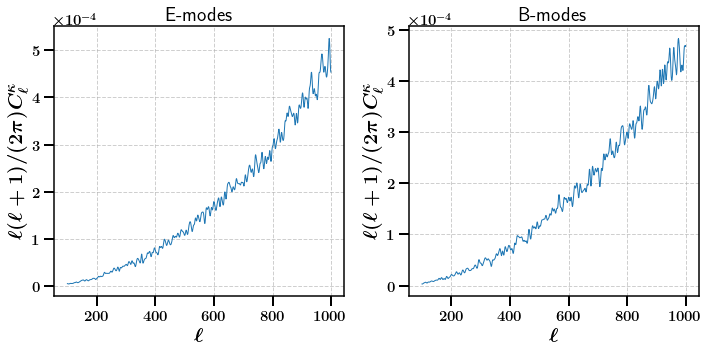
The convergence angular power spectrum requires convergence maps. We can tell the map module to calculate them from the shear maps by passing the use_shear_maps=True flag. Here we use the second tomographic bin using bin=1.
[16]:
stats = m.calc_summary_stats(['CLs'], use_shear_maps=True, bin=1)

fig, axarr = plt.subplots(ncols=2, nrows=1,figsize=(10,5))
axarr[0].plot(np.arange(100, 1000, 1), np.arange(100, 1000, 1)* (np.arange(100, 1000, 1) + 1) / (2. * np.pi) * stats['E']['CLs'].ravel()[100:])
axarr[1].plot(np.arange(100, 1000, 1), np.arange(100, 1000, 1)* (np.arange(100, 1000, 1) + 1) / (2. * np.pi) * stats['B']['CLs'].ravel()[100:])
axarr[0].set_title(r'E-modes')
axarr[1].set_title(r'B-modes')
axarr[0].set_xlabel(r'$\ell$')
axarr[0].set_ylabel(r'$\ell (\ell + 1) / (2 \pi) C_{\ell}^{\kappa}$')
axarr[1].set_xlabel(r'$\ell$')
axarr[1].set_ylabel(r'$\ell (\ell + 1) / (2 \pi) C_{\ell}^{\kappa}$')
plt.subplots_adjust(wspace=0.5)
Cross-Convegence Angular Power spectrum
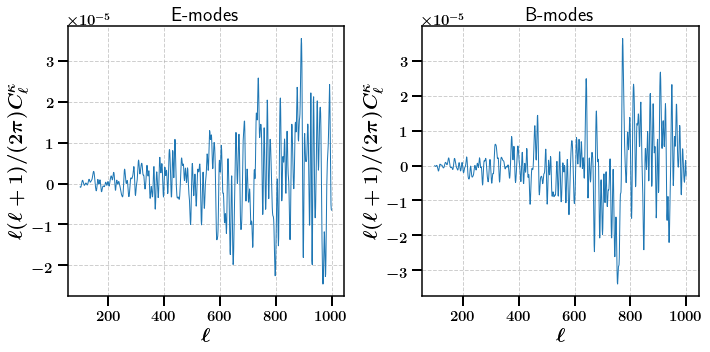
Since we have data for multiple tomographic bins available we can also calculate cross-tomographic statistics. Here we calculate the cross convergence angular power spectrum. By default this will just use the first two instances (cross_bins=[0, 1]). Here we choose the second and third (cross_bins=[1, 2]).
[17]:
stats = m.calc_summary_stats(['CrossCLs'], use_shear_maps=True, cross_bins=[1, 2])

fig, axarr = plt.subplots(ncols=2, nrows=1,figsize=(10,5))
axarr[0].plot(np.arange(100, 1000, 1), np.arange(100, 1000, 1)* (np.arange(100, 1000, 1) + 1) / (2. * np.pi) * stats['E']['CrossCLs'].ravel()[100:])
axarr[1].plot(np.arange(100, 1000, 1), np.arange(100, 1000, 1)* (np.arange(100, 1000, 1) + 1) / (2. * np.pi) * stats['B']['CrossCLs'].ravel()[100:])
axarr[0].set_title(r'E-modes')
axarr[1].set_title(r'B-modes')
axarr[0].set_xlabel(r'$\ell$')
axarr[0].set_ylabel(r'$\ell (\ell + 1) / (2 \pi) C_{\ell}^{\kappa}$')
axarr[1].set_xlabel(r'$\ell$')
axarr[1].set_ylabel(r'$\ell (\ell + 1) / (2 \pi) C_{\ell}^{\kappa}$')
plt.subplots_adjust(wspace=0.5)
Some Non-Gaussian statistics
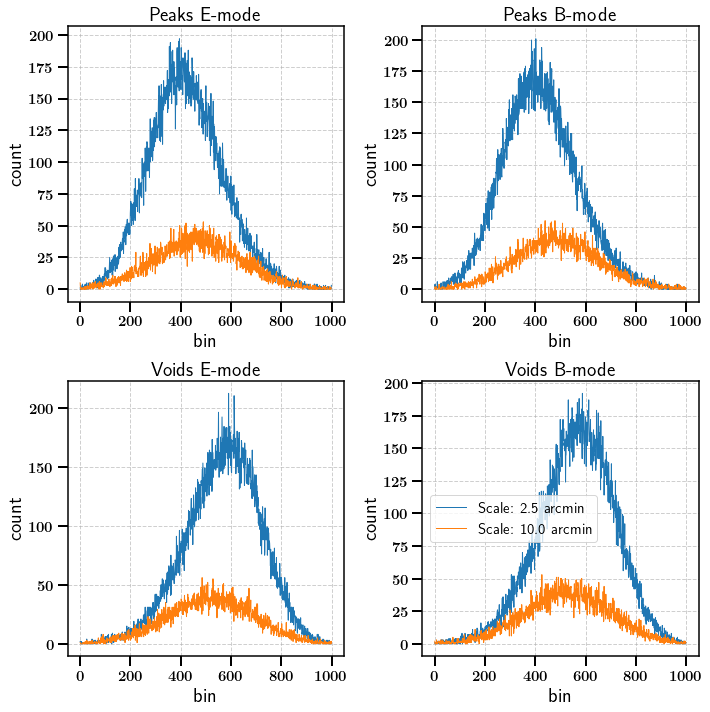
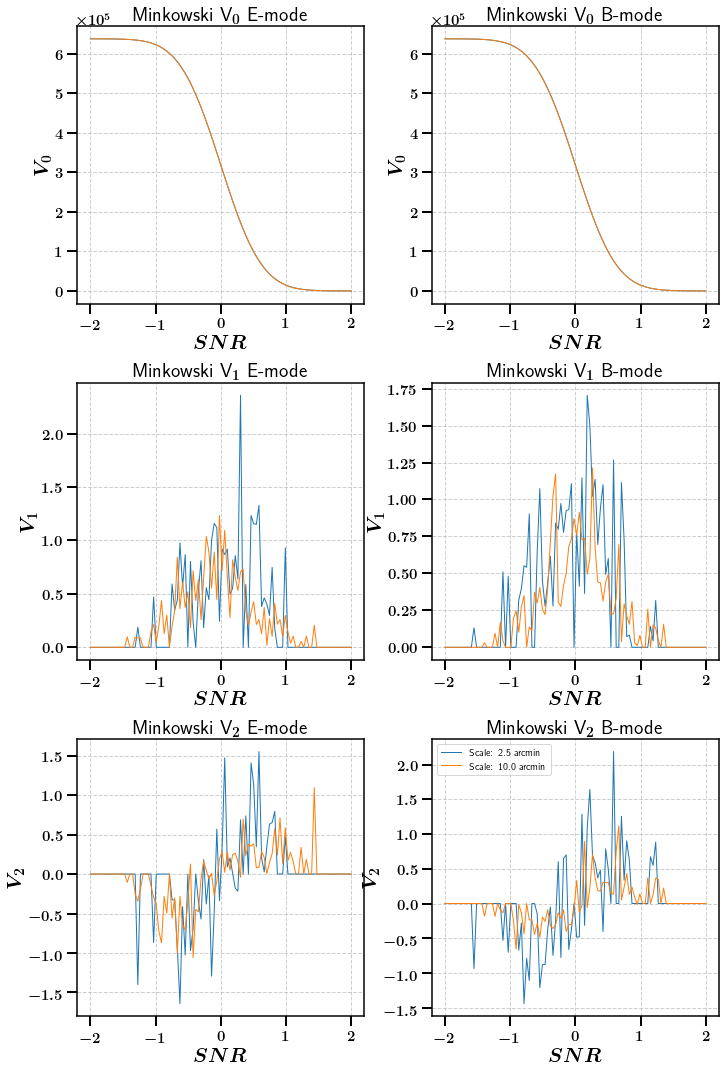
The map module also allows to use a multiscale approach. The convergence map can be smmothed with Gaussian smoothing kernels of different sizes to select features of different scales. Here we use two scales (2.5 arcmin and 10 arcmin)
Lets start by calculating some Peak functions, Void functions and Minkowski functionals
[18]:
stats_ng = m.calc_summary_stats(['Peaks', 'Voids', 'Minkowski'], scales=[2.5, 10.0], use_shear_maps=True, bin=0)
[19]:
fig, axarr = plt.subplots(ncols=2, nrows=2,figsize=(10,10))
for ii, scale in enumerate([2.5, 10.0]):
    axarr[0, 0].plot(np.arange(1000)[1:-1], stats_ng['E']['Peaks'][ii][1:-2],
                     label="Scale: {} arcmin".format(scale))
    axarr[0, 1].plot(np.arange(1000)[1:-1], stats_ng['B']['Peaks'][ii][1:-2],
                     label="Scale: {} arcmin".format(scale))
    axarr[1, 0].plot(np.arange(1000)[1:-1], stats_ng['E']['Voids'][ii][1:-2],
                     label="Scale: {} arcmin".format(scale))
    axarr[1, 1].plot(np.arange(1000)[1:-1], stats_ng['B']['Voids'][ii][1:-2],
                     label="Scale: {} arcmin".format(scale))


axarr[0,0].set_title('Peaks E-mode')
axarr[0,1].set_title('Peaks B-mode')

axarr[1,0].set_title('Voids E-mode')
axarr[1,1].set_title('Voids B-mode')

axarr[1,0].set_xlabel(r'bin')
axarr[1,1].set_xlabel(r'bin')
axarr[0,0].set_xlabel(r'bin')
axarr[0,1].set_xlabel(r'bin')

axarr[0,0].set_ylabel('count')
axarr[1,0].set_ylabel('count')
axarr[0,1].set_ylabel('count')
axarr[1,1].set_ylabel('count')

plt.legend(fontsize=15)
plt.subplots_adjust(hspace=0.5, wspace=0.5)
[21]:
fig, axarr = plt.subplots(ncols=2, nrows=3,figsize=(10,15))
for ii, scale in enumerate([2.5, 10.0]):
    axarr[0, 0].plot(np.linspace(-2.0, 2.0, 100), stats_ng['E']['Minkowski'][ii][:100].ravel(), label="Scale: {} arcmin".format(scale))
    axarr[0, 1].plot(np.linspace(-2.0, 2.0, 100), stats_ng['B']['Minkowski'][ii][:100].ravel(), label="Scale: {} arcmin".format(scale))

    axarr[1, 0].plot(np.linspace(-2.0, 2.0, 100), stats_ng['E']['Minkowski'][ii][100:200].ravel(), label="Scale: {} arcmin".format(scale))
    axarr[1, 1].plot(np.linspace(-2.0, 2.0, 100), stats_ng['B']['Minkowski'][ii][100:200].ravel(), label="Scale: {} arcmin".format(scale))

    axarr[2, 0].plot(np.linspace(-2.0, 2.0, 100), stats_ng['E']['Minkowski'][ii][200:].ravel(), label="Scale: {} arcmin".format(scale))
    axarr[2, 1].plot(np.linspace(-2.0, 2.0, 100), stats_ng['B']['Minkowski'][ii][200:].ravel(), label="Scale: {} arcmin".format(scale))

axarr[0,0].set_title(r'Minkowski V$_0$ E-mode')
axarr[0,1].set_title(r'Minkowski V$_0$ B-mode')
axarr[1,0].set_title(r'Minkowski V$_1$ E-mode')
axarr[1,1].set_title(r'Minkowski V$_1$ B-mode')
axarr[2,0].set_title(r'Minkowski V$_2$ E-mode')
axarr[2,1].set_title(r'Minkowski V$_2$ B-mode')

axarr[0,0].set_xlabel(r'$SNR$')
axarr[0,1].set_xlabel(r'$SNR$')
axarr[1,0].set_xlabel(r'$SNR$')
axarr[1,1].set_xlabel(r'$SNR$')
axarr[2,0].set_xlabel(r'$SNR$')
axarr[2,1].set_xlabel(r'$SNR$')

axarr[0,0].set_ylabel(r'$V_0$')
axarr[0,1].set_ylabel(r'$V_0$')
axarr[1,0].set_ylabel(r'$V_1$')
axarr[1,1].set_ylabel(r'$V_1$')
axarr[2,0].set_ylabel(r'$V_2$')
axarr[2,1].set_ylabel(r'$V_2$')

plt.legend(fontsize=10)
plt.subplots_adjust(hspace=0.5, wspace=0.5)
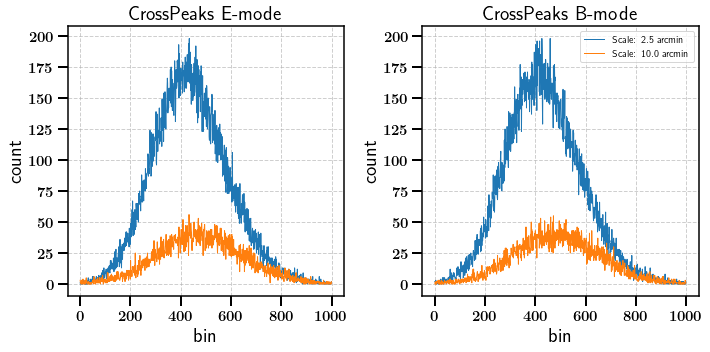
We can also calculate NG statistics on convolved maps. Here we look at Cross tomographic peaks for example. The convolved map is generated by multiplying the square roots of the spherical harmonic coefficients of the two maps.
[22]:
stats_ng = m.calc_summary_stats(['CrossPeaks'], scales=[2.5, 10.0], use_shear_maps=True, cross_bins=[0, 1])
[23]:
fig, axarr = plt.subplots(ncols=2, nrows=1,figsize=(10,5))
for ii, scale in enumerate([2.5, 10.0]):
    axarr[0].plot(np.arange(1000)[1:-1], stats_ng['E']['CrossPeaks'][ii][1:-2],
                     label="Scale: {} arcmin".format(scale))
    axarr[1].plot(np.arange(1000)[1:-1], stats_ng['B']['CrossPeaks'][ii][1:-2],
                     label="Scale: {} arcmin".format(scale))


axarr[0].set_title('CrossPeaks E-mode')
axarr[1].set_title('CrossPeaks B-mode')

axarr[0].set_xlabel(r'bin')
axarr[1].set_xlabel(r'bin')

axarr[0].set_ylabel('count')
axarr[1].set_ylabel('count')

plt.legend(fontsize=10)
plt.subplots_adjust(hspace=0.5, wspace=0.5)
Example - Summary
The summary module is meant to postprocess a large number of realisations of summary statistics that were obtained from simulations for example. It computes mean data vectors and covariance matrices for each parameter configuration. These can then be used to calculate the likelihood using the likelihood module.
[6]:
from estats.summary import summary
To demonstrate the summary module we first simulate some (totally unrealistic) data vector realisations for CLs and Peaks for different parameter configurations. We call the parameters Cosmology and Nuisance. We also assume a tomographic sample with 3 bins.
[7]:
Cosmologies = [-1.0, 0.5, 3.5]
Nuisance = [20., -40., 60.]
Tomos = ['1x1', '2x2', '3x3']

CLs   = {}
Peaks = {}

# simulate data vectors for each parameter point
for set in range(len(Cosmologies)):

    # simulate for each tomographic bin
    for tomo in Tomos:
        CL = np.zeros((0,100))
        Peak = np.zeros((0,100))

        # simulate 10 realisations for each parameter point
        for reals in range(10):
            CL = np.vstack((CL, np.random.rand(100)))

            # in case of peaks assume that we applied 3 different smoothing scales to the maps (arbitrary)
            for scale in range(3):
                Peak = np.vstack((Peak, np.random.randint(50, size=100)))

        CLs[(Cosmologies[set], Nuisance[set], tomo)]  = CL
        Peaks[(Cosmologies[set], Nuisance[set], tomo)]  = Peak
Now we initialize the summary object and we feed the data into it. Here we do it one by one but one could also give it the full data at once or read it from a file. We also set a few parameters that are specified for the Peaks and CLs statistics plugins.
[8]:
summ = summary(scales=[1.,2.,3.],
               CLs_min=0, CLs_max=100,
               CLs_sliced_bins=15,
               Peaks_steps=100,
               Peaks_sliced_bins=10,
               min_count=10)
[9]:
# Feed in the CL data
for item in CLs.items():
    summ.readin_stat_data(item[1],
                          statistic='CLs',
                          meta_list=list(item[0]),
                          parameters=['Cosmology', 'Nuisance', 'tomo'])

# Feed in the Peaks data
for item in Peaks.items():
    summ.readin_stat_data(item[1],
                          statistic='Peaks',
                          meta_list=list(item[0]),
                          parameters=['Cosmology', 'Nuisance', 'tomo'])
Lets have a look at the CL data table and the corrsponding meta data table
[10]:
print('CL data (shape is number of samples, data vector size)')
print(summ.get_data('CLs'))
print(f"Shape {summ.get_data('CLs').shape}")
print('')
print('CL meta data.')
print(summ.get_meta('CLs'))
print(f"Shape {summ.get_meta('CLs').shape}")
print('Each column indicates one meta data attribute.')
print('From left to right: Tomographic bin label, Number of realisations for this parameter configuration,')
print('Cosmology parameter, Nuisance parameter')
CL data (shape is number of samples, data vector size)
[[9.62683791e-01 1.82956170e-01 8.86561849e-01 ... 6.38268327e-01
  8.25959573e-01 7.31246910e-01]
 [7.36886529e-01 5.79222392e-01 5.64855792e-01 ... 8.93452385e-01
  8.44710539e-01 1.74636202e-01]
 [9.41150376e-01 3.33654950e-01 4.53676421e-01 ... 6.85928440e-01
  8.40135694e-01 6.36534637e-01]
 ...
 [7.61440033e-01 9.72686209e-01 9.36730840e-01 ... 9.65973285e-04
  9.66321611e-01 2.54141501e-01]
 [6.55831244e-01 6.44133765e-02 8.25828656e-01 ... 6.53943987e-01
  2.73614895e-01 5.59893966e-01]
 [6.29133551e-01 9.61235243e-02 6.77814655e-02 ... 8.33498284e-01
  7.55108345e-01 3.58598233e-01]]
Shape (90, 100)

CL meta data.
[('1x1', 10., -1. ,  20.) ('1x1', 10.,  0.5, -40.)
 ('1x1', 10.,  3.5,  60.) ('2x2', 10., -1. ,  20.)
 ('2x2', 10.,  0.5, -40.) ('2x2', 10.,  3.5,  60.)
 ('3x3', 10., -1. ,  20.) ('3x3', 10.,  0.5, -40.)
 ('3x3', 10.,  3.5,  60.)]
Shape (9,)
Each column indicates one meta data attribute.
From left to right: Tomographic bin label, Number of realisations for this parameter configuration,
Cosmology parameter, Nuisance parameter
Using these data vector realisations we first create a binning scheme that can be used to downbin the long data vectors into wider bins. This is specified in the statistics plugins. For CLs this is just a normal equal width binning whereas for the Peaks the bins will be adjusted such that in each bin there are at least min_count peaks for each realisation.
[11]:
for bin in Tomos:
    summ.generate_binning_scheme(statistics=['Peaks', 'CLs'], bin=bin)
Now we use the generated binning schemes to downbin the data vectors
[12]:
summ.downbin_data(statistics=['Peaks','CLs'])
2022-04-06 16:08:49,382 -   summary.py: 991 -    INFO - Down sampled data vectors for statistic Peaks from 100 bins to 10 bins
2022-04-06 16:08:49,385 -   summary.py: 991 -    INFO - Down sampled data vectors for statistic CLs from 100 bins to 15 bins
Lets have a look at the shape of the CL data table once more. It has only 15 bins now instead of 100 as before.
[15]:
print(summ.get_data('CLs'))
print(f"Shape: {summ.get_data('CLs').shape}")
[[0.54527625 0.4080248  0.68116329 ... 0.60165549 0.35039202 0.54938893]
 [0.61368244 0.52548164 0.33574351 ... 0.63749449 0.46664761 0.57891692]
 [0.45937134 0.47861172 0.43004315 ... 0.34843178 0.49157724 0.65539141]
 ...
 [0.7664392  0.44386432 0.36125999 ... 0.40198764 0.40637657 0.38646677]
 [0.51820828 0.58095596 0.7291135  ... 0.50177112 0.37160335 0.55420038]
 [0.65130164 0.44564565 0.44593444 ... 0.67820101 0.51913232 0.65569616]]
Shape: (90, 15)
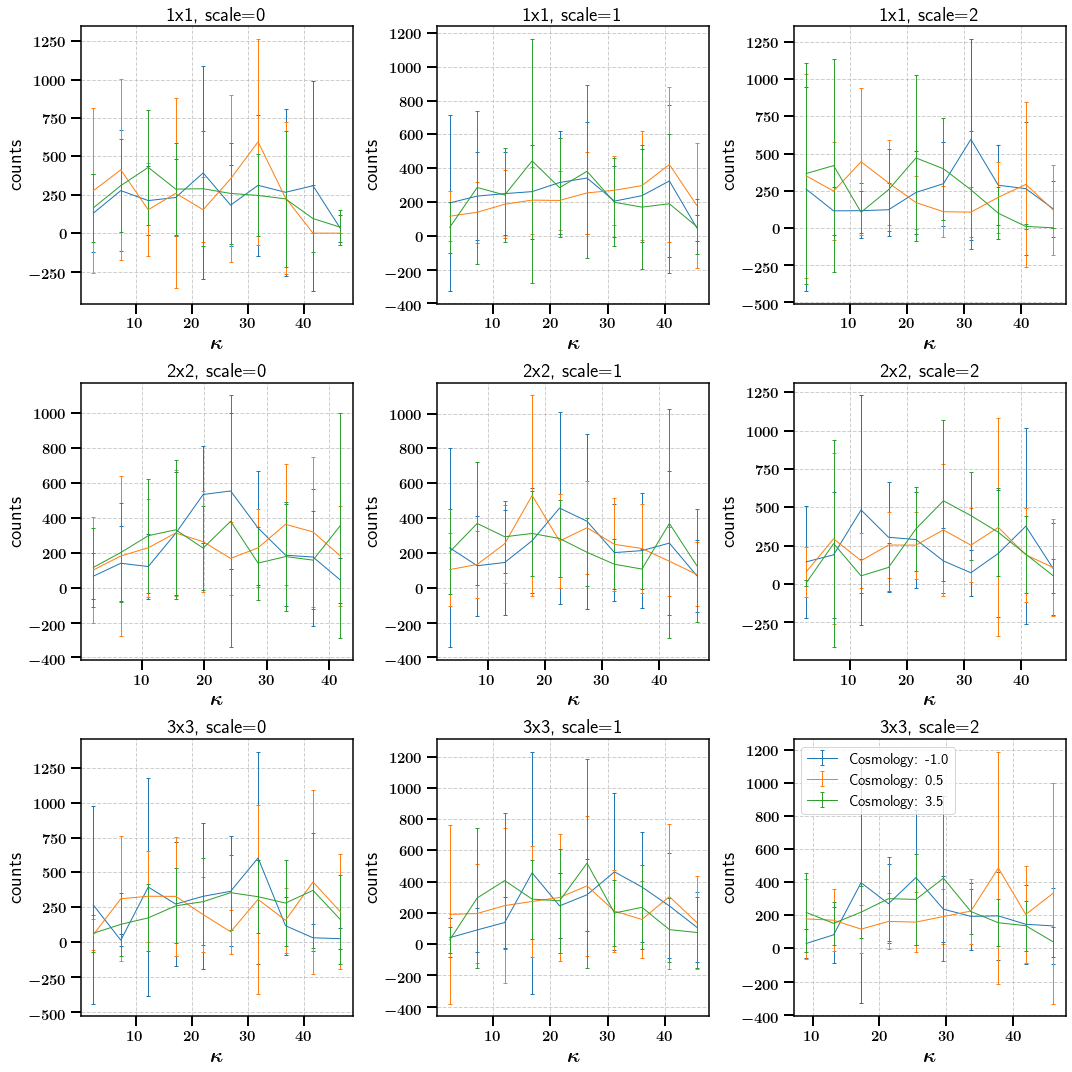
Next we calculate the mean data vectors, standard deviations and covariance matrices for the Peaks individually at each parameter setting using the 10 realisations that we have stored for each parameter setting
[16]:
# For the Peaks (calculating the covariance matrices in this case)
Peak_Means, Peak_Errors, Peak_Covs = summ.get_full_summary(statistic='Peaks')
Lets look at the mean data vectors and standard deviations. The binning scheme can be used to put the labels on the x-axis
[18]:
# Visualization of the mean data vectors as a function of their Cosmology parameter
# From the binning scheme we can get the centers of the bins

fig, axarr = plt.subplots(ncols=3, nrows=3, figsize=(15,15))
for xx in range(Peak_Means.shape[0]):
    bin = summ.get_meta(statistic='Peaks')['tomo'][xx]
    num = int(bin[0])
    cosmo = summ.get_meta(statistic='Peaks')['Cosmology'][xx]
    for scale in range(3):
        axarr[int(num - 1), scale].errorbar(summ.get_binning_scheme(statistic='Peaks', bin=bin)[1][scale],
                              Peak_Means[xx,:][10*scale:10*(scale + 1)], yerr=Peak_Errors[xx,:][10*scale:10*(scale + 1)],
                                            label='Cosmology: {}'.format(cosmo), capsize=2)
        axarr[int(num - 1), scale].set_xlabel(r'$\kappa$')
        axarr[int(num - 1), scale].set_ylabel('counts')
        axarr[int(num - 1), scale].set_title('{}, scale={}'.format(bin, scale))

plt.legend()
plt.tight_layout()
We now combine the data vectors from the different tomographic bins to peroform a tomographic analysis. The order of the tomographic bin combinations in the final data vector can be defined using the cross_ordering keyword or we can just let the module guess the order.
[19]:
summ.join_redshift_bins()
2022-04-06 16:11:03,551 - summary.py: 674 - WARNING - Did not find cross_ordering entry. Trying to guess the order of the tomographic bins.
100.0% | [##########] | Progress: 3 / 3 | Time: 0.0s | ETA: --0s
2022-04-06 16:11:03,556 -   summary.py: 744 -    INFO - Joined data from tomographic bins for statistic CLs. The order is ['1x1' '2x2' '3x3']
2022-04-06 16:11:03,558 -   summary.py: 674 - WARNING - Did not find cross_ordering entry. Trying to guess the order of the tomographic bins.
100.0% | [##########] | Progress: 3 / 3 | Time: 0.0s | ETA: --0s
2022-04-06 16:11:03,563 - summary.py: 744 - INFO - Joined data from tomographic bins for statistic Peaks. The order is ['1x1' '2x2' '3x3']
Lets have a look at the data and meta data again. Since there were three tomographic bins, only one third of the realisations is left but each one is now 3x the initial length (tomographic bins were concatenated)
Note that the tomographic bin label for a combined data vector is set to -1 automatically
[21]:
print('CL data (shape is number of samples, data vector size)')
print(summ.get_data('CLs'))
print(f"Shape {summ.get_data('CLs').shape}")
print('')
print('CL meta data.')
print(summ.get_meta('CLs'))
print(f"Shape {summ.get_meta('CLs').shape}")
CL data (shape is number of samples, data vector size)
[[0.54527625 0.4080248  0.68116329 ... 0.57282041 0.58385236 0.45941297]
 [0.61368244 0.52548164 0.33574351 ... 0.36378873 0.45190587 0.670137  ]
 [0.45937134 0.47861172 0.43004315 ... 0.66343432 0.46042466 0.29210968]
 ...
 [0.35322592 0.50357871 0.36629497 ... 0.40198764 0.40637657 0.38646677]
 [0.49047264 0.65123359 0.38489559 ... 0.50177112 0.37160335 0.55420038]
 [0.46584893 0.45291614 0.44190562 ... 0.67820101 0.51913232 0.65569616]]
Shape (30, 45)

CL meta data.
[(-1., 10., -1. ,  20.) (-1., 10.,  0.5, -40.) (-1., 10.,  3.5,  60.)]
Shape (3,)
We now assume that we want to go even further and combine the data vectors of the CLs and Peaks to perform a joined analysis
This creates an additional statistic in our sample called CLs-Peaks which holds the combined data vectors.
[22]:
summ.join_statistics(statistics=['CLs', 'Peaks'])
2022-04-06 16:13:01,241 - summary.py: 647 - INFO - Constructed joined statistic CLs-Peaks
The two data vectors have now been concatenated for each realisation individually
[23]:
print('CLs-Peaks data (shape is number of samples, data vector size)')
print(summ.get_data('CLs-Peaks'))
print(f"Shape {summ.get_data('CLs-Peaks').shape}")
print('')
print('CLs-Peaks meta data.')
print(summ.get_meta('CLs-Peaks'))
print(f"Shape {summ.get_meta('CLs-Peaks').shape}")
CLs-Peaks data (shape is number of samples, data vector size)
[[5.45276249e-01 4.08024804e-01 6.81163292e-01 ... 0.00000000e+00
  0.00000000e+00 0.00000000e+00]
 [6.13682441e-01 5.25481644e-01 3.35743514e-01 ... 0.00000000e+00
  0.00000000e+00 0.00000000e+00]
 [4.59371344e-01 4.78611718e-01 4.30043154e-01 ... 0.00000000e+00
  0.00000000e+00 0.00000000e+00]
 ...
 [3.53225915e-01 5.03578709e-01 3.66294973e-01 ... 3.13000000e+02
  2.90000000e+02 9.10000000e+01]
 [4.90472641e-01 6.51233585e-01 3.84895594e-01 ... 3.52000000e+02
  3.25000000e+02 2.70000000e+02]
 [4.65848934e-01 4.52916145e-01 4.41905622e-01 ... 4.77000000e+02
  0.00000000e+00 0.00000000e+00]]
Shape (30, 135)

CLs-Peaks meta data.
[(-1., 10., -1. ,  20.) (-1., 10.,  0.5, -40.) (-1., 10.,  3.5,  60.)]
Shape (3,)
Now we can go all out and calculate the mean data vectors, errors and covariance metrices for the combined data vectors at each parameter point
[24]:
# For the Peaks and CLs combined (calculating the precision matrices in this case)
CLs_Peak_Means, CLs_Peak_Errors, CLs_Peak_Prec = summ.get_full_summary(statistic='CLs-Peaks')
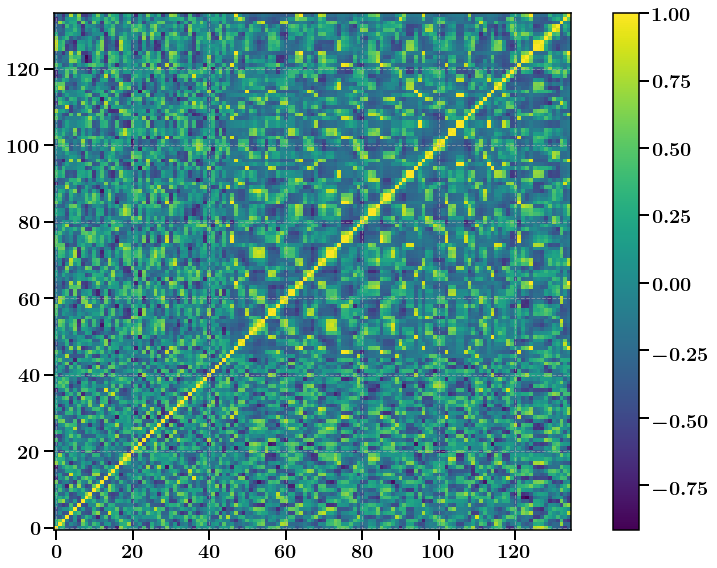
Lets have a look at one of the Correlation matrices (unphysical of course)
[25]:
# Convert covariance to correlation
import copy
corr = copy.copy(CLs_Peak_Prec[0])
for ii in range(CLs_Peak_Prec[0].shape[0]):
    for jj in range(CLs_Peak_Prec[0].shape[1]):
        corr[ii, jj] /= np.sqrt(CLs_Peak_Prec[0][ii, ii] * CLs_Peak_Prec[0][jj, jj])

plt.figure(figsize=(12,8))
plt.imshow(corr)
plt.xticks(fontsize=20)
plt.yticks(fontsize=20)
cbar = plt.colorbar()
cbar.ax.tick_params(labelsize=20)
Example - Likelihood
Assume that we ran a large number of simulations to predict some summary statistic for different points in our potentially high dimesional parameter space. Given a measurement of the summary statistic from a survey we now wish to constrain the paramter space using a likelihood approach. The likelihood module allows to build an emulator for the summary statistic based on the simulations and to calculate the negative loglikelihood everywhere in the parameter space.
[2]:
from estats.likelihood import likelihood
The likelihood module distinguishes two types of parameters:
parameters: It is assumed that the space spanned by the parameters is sampled densly enough such that an emulator can be trained for this space.
nuisances: Sometimes there are parameters that have an impact on the summary statistics that is independent from the other parameters (for example multiplicative shear bias in weak lensing). In this case it is not necessary to increase the dimensionality of the parameter space but instead one can only run a few delta simulations around some fiducial parameter configuration. For such parameters we can build polynomial scaling relations that modify the summary statistic independently from the other parameters.
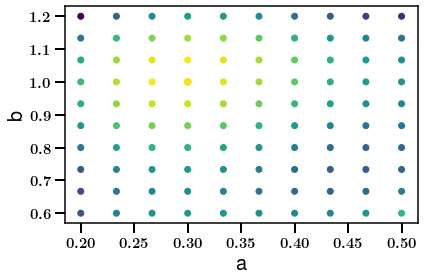
Firstly, we produce some mock angular power spectrum data. We assume that the data space is sampled sufficiently densly along the directions of the a and b parameters. We also have a bunch of simulations at the fiducial point (a=0.3, b=1.0) where we varied the nuisance parameter n.
[3]:
par1 = np.linspace(0.2, 0.5, 10)
par2 = np.linspace(0.6, 1.2, 10)
par_grid = np.meshgrid(par1, par2)
par1 = par_grid[0].ravel()
par2 = par_grid[1].ravel()

nuis = np.linspace(-1., 1., 10)
par1 = np.append(par1, np.full((10,), 0.3))
par2 = np.append(par2, np.full((10,), 1.0))
nuis = np.append(np.full((100,), 0.0), nuis)

CLs = np.zeros((0, 20))

dtype = np.dtype({'names': tuple(['tomo', 'NREALS', 'a', 'b', 'n']),
                  'formats': tuple(['i4', 'i4', 'f8', 'f8', 'f8'])})
meta = np.zeros((0, 5))

# simulate data vectors for each parameter point
for ii in range(len(par1)):

    if np.isclose(par1[ii], 0.3) & np.isclose(par2[ii], 1.0) \
            & np.isclose(nuis[ii], 0.0):
        val = 2.
    else:
        val = 1.
    CL = np.full((20,), val)
    CLs = np.vstack((CLs, CL))

    m = np.asarray([0., 10000., par1[ii], par2[ii], nuis[ii]])
    meta = np.vstack((meta, m))

fields = []
for line in meta:
    fields.append(tuple(line))
meta = np.core.records.fromrecords(fields, dtype=dtype)
fiducial_data = np.random.standard_normal((100, 20))
We now have a meta data array that holds the locations in the a,b,n parameter space where we ran “simulations” and a data array containing the predicted CLs at the different parameter locations. We also have a bunch of simulations at the fiducial point that we will use to build the covariance matrix.
Now we set up the likelihood instance
[4]:
like = likelihood(parameters=['a', 'b'],
                  parameter_fiducials=[0.3, 1.0],
                  nuisances=['n'],
                  nuisance_fiducials=[0.0],
                  prior_configuration=[['flat', 0.2, 0.5],
                                       ['flat', 0.6, 1.2],
                                       ['normal', 0.0, 3.0]],
                  CLs_sliced_bins=20,
                  statistic='CLs',
                  multi_bin=[False],
                  n_tomo_bins=1)
We read in all the data and calculate the precision matrix
[5]:
like.readin_interpolation_data(
    means_path=CLs, meta_path=meta, systematics=True,
    fiducial_data_path=fiducial_data, build_precision_matrix=True)
2022-04-14 15:48:37,691 - likelihood.py:1606 -    INFO - Set prior configuration to [['flat', 0.2, 0.5], ['flat', 0.6, 1.2], ['normal', 0.0, 3.0]]
2022-04-14 15:48:37,696 - likelihood.py: 607 -    INFO - Filter set. Keeping 20 out of 20 data vector elements
Time to build the GRP emulator for the a and b parameters. Here we use a Gaussian Process Regressor.
[6]:
like.build_emulator(interpolation_mode='GPR')
2022-04-14 15:48:37,906 - likelihood.py: 725 -    INFO - Building emulator
2022-04-14 15:48:37,908 - likelihood.py: 764 -    INFO - Building GPR emulator
2022-04-14 15:48:37,909 - likelihood.py: 779 -    INFO - Training GPR with RBF kernel.
Additionally we use the simulations with varying n but fixed a and b parameters to fit some linear models that describe how each element of the CLs changes when n is varied. This allows us to approximately model the influcence of n without having to add an additional dimension to the simulation grid
[7]:
like.build_scalings(fitting='1d-poly')
2022-04-14 15:48:38,173 - likelihood.py: 995 - INFO - Built scaling relations
Let us pretend that we have a perfect, noiseless measurement of the CLs given that the true parameters are exactly at the fiducial point
[8]:
measurement = np.full(20, (0.3 * 1.0))
measurement = np.full(20, 2.0)
We can now evaluate the negative logarithmic likelihood function on a grid of a,b,n to find the pont of maximum likelihood
[9]:
lnps = []
for ii, pars in enumerate(zip(meta['a'], meta['b'], meta['n'])):
    if np.isclose(pars[0], 0.3) & np.isclose(pars[1], 1.0) \
            & np.isclose(pars[2], 0.0):
        fiducial_idx = ii
    lnp = like.get_neg_loglikelihood(
        list(pars),
        measurement)
    lnps.append(lnp)
Since we know the truth let us check if we recovered it correctly:
[10]:
fiducial_idx == np.argmax(lnps)
[10]:
True
[11]:
plt.scatter(meta['a'], meta['b'], c=lnps)
plt.xlabel('a')
plt.ylabel('b')
plt.show()
